


What are reports
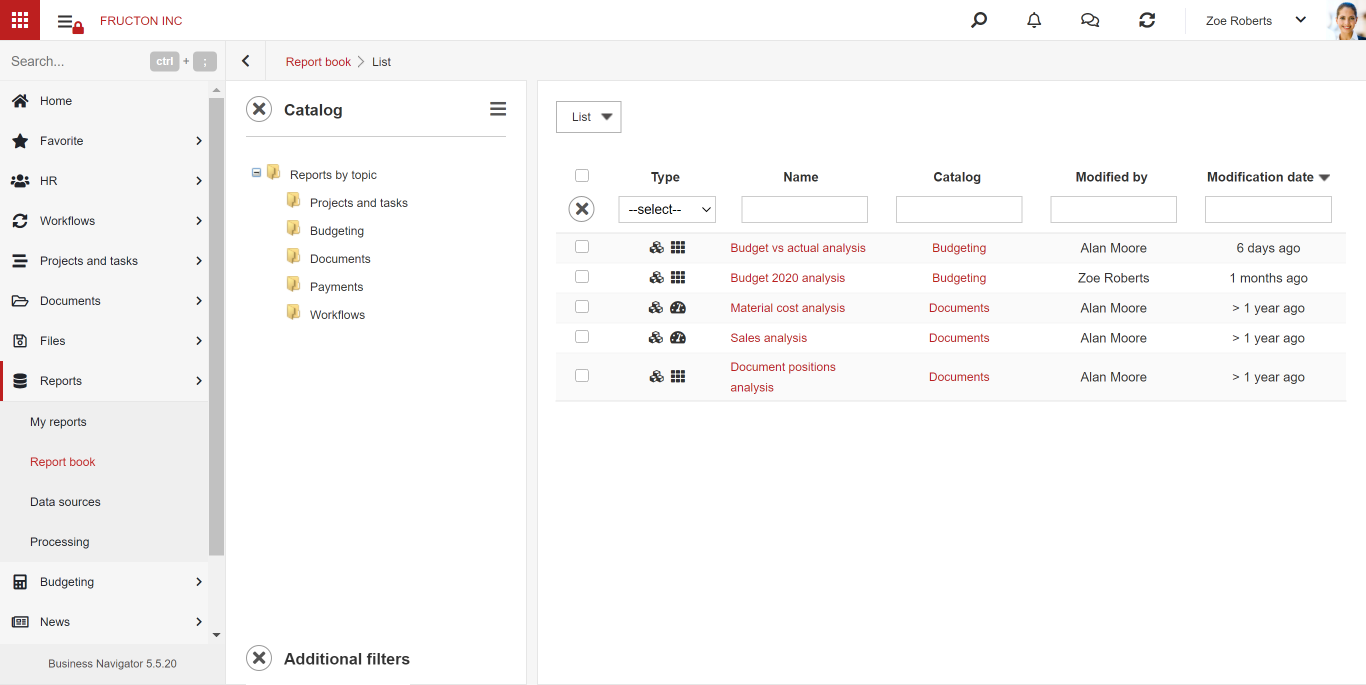
The reports in the Navigator system are located in the Reports application or the Data warehouse. Under My Reports there are reports created by the User, in the Report Book there are redefined reports delivered with the system. The Data Sources menu contains definitions for connections to the database or to OLAP cubes. The Processing menu shows the status of data processing in the data warehouse.
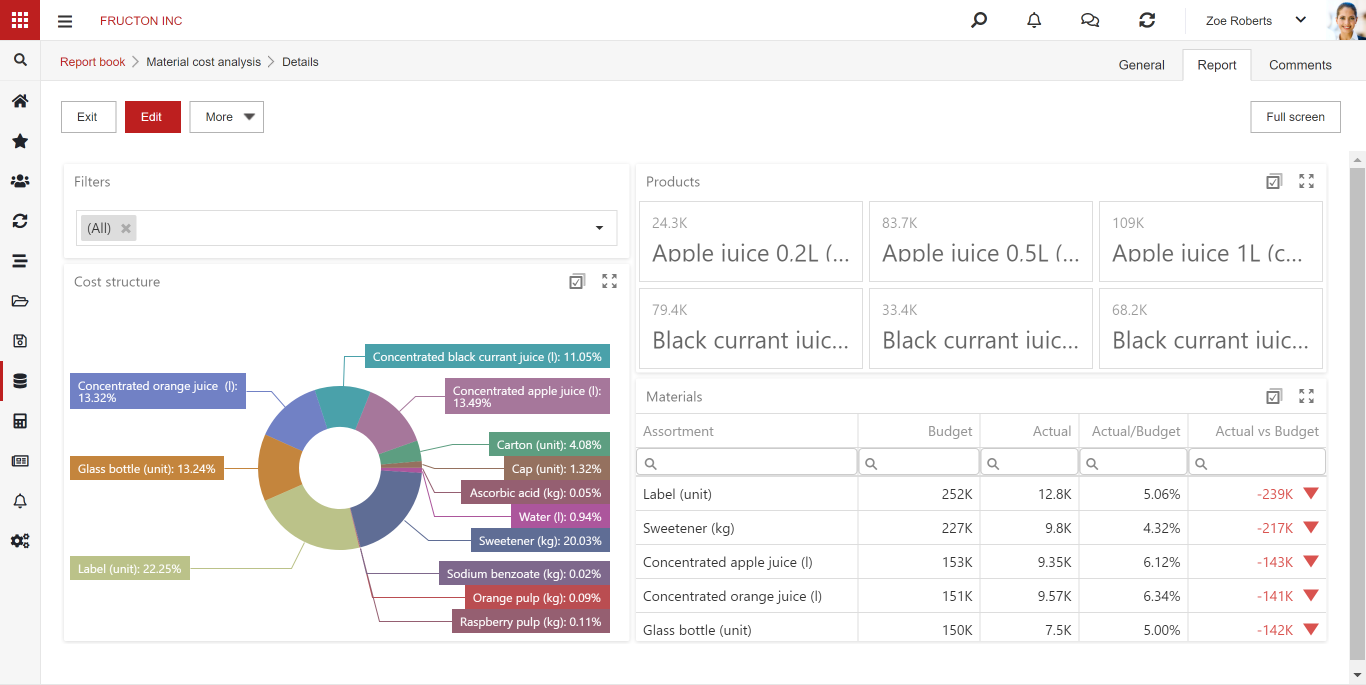
Reports are used for graphical or tabular presentation of numerical data. The reports can then be placed on the desktops and presented in the system. An example of such a dashboard is the sales report available in the demo version of Navigator.
Pivot tables
One type of report is PivotTables. They work in the same way as pivot tables in spreadsheets, e.g. in Microsoft Excel.
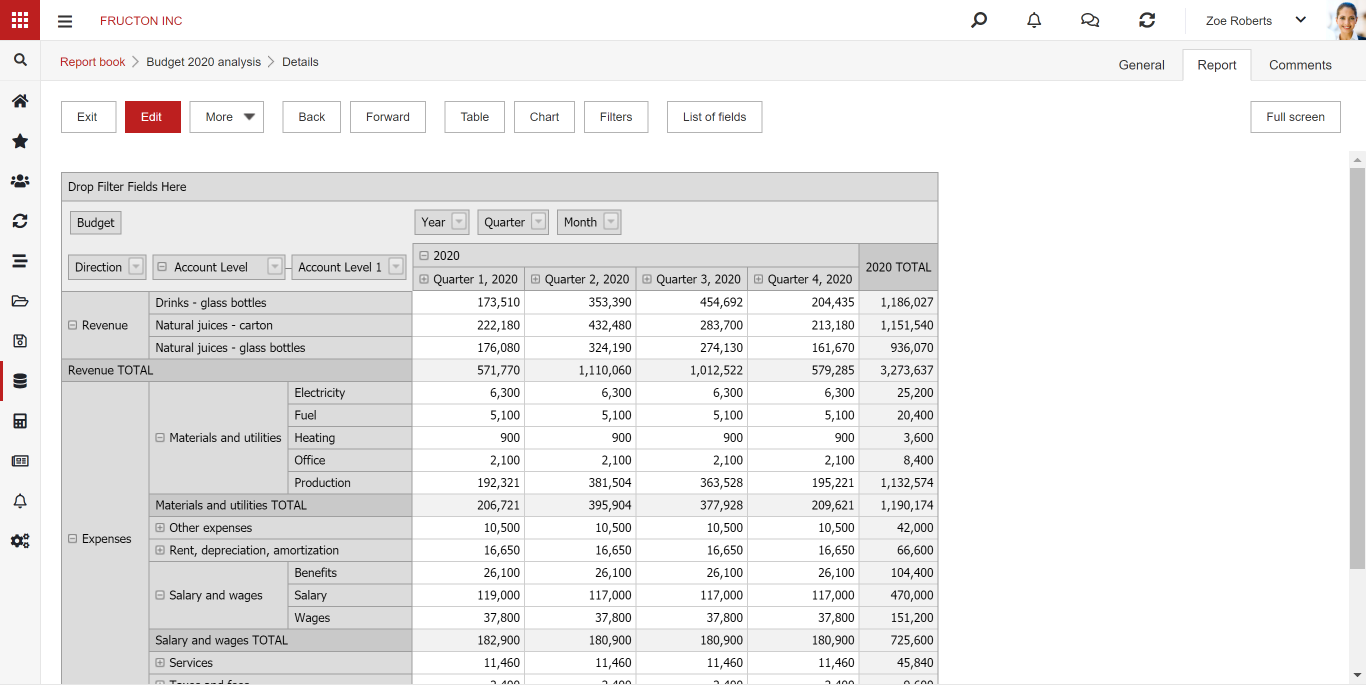
An example of a PivotTable based on the Documents OLAP cube is shown above. The lines show the items and the columns the periods. Pivot tables can be parameterized on an ongoing basis by filtering dimensions – as in the example above where only January 2017 is shown.
Reports can be much more elaborate with an extensive hierarchy on rows and columns.
Creating reports
To create a new report, select the Add option. In the next steps, select the data source, data source parameters and then the report type. Finally, enter a name for the report.

Data sources:
Data sources are defined in the Data Sources menu. At this point, we only indicate previously defined sources.
OLAP database – after selecting this option, the report will be based on OLAP (On-Line Analytical Processing) cubes defined in the data warehouse. The data source parameter in this case is the name of the previously defined cube.
SQL database – after selecting this option, the report will be based on the SQL query to the database. The source parameter in this case is the name of the defined SQL function
Report server – after selecting this option, the report will be based on the one defined in the Reporting Services system. In this case, there is no need to provide additional source parameters.
List – after selecting this option, the report will be based on the list defined in the Navigator system. The source parameter in this case will be the list name.
Report type
Excel pivot table – selecting this option and pressing the Next button will start the Microsoft Excel program. Further configuration of the report will take place in this program. We have the full functionality of Excel at our disposal. Note: For this option to work properly, Microsoft Excel must be installed and the WebDAV option must be configured for use with Microsoft Office.
More about the pivot table can be found in the Microsotf documentation
Express pivot table – this option works in the same way as Excel pivot table, except that instead of opening Microsoft Excel, you build tables directly in the Navigator system.
After completing the configuration and approving the report, we get the report configuration view. The basic thing is to define the fields in the PivotTable. In the example, the list of purchase invoices was used as the data source, however, the data source is of little importance here.
After defining the fields, we have a ready pivot table report. We also have a table and chart configuration at our disposal.
In the Table option, you can define the table visibility, the visibility of table elements (row sums, column sums) or the method of field aggregation.

A PivotTable can also be used to define a chart. After selecting the Chart option, we can create a chart based on the pivot table. In addition to the basic configuration of the visibility of the graph of its elements, we can configure the type of the graph or placement on the page.
Dashoard – the last type of report is the dashboard. While a pivot table is used to present data in tabular form, the chart is only an addition, in the case of a dashboard, charts are the basis of this report. After confirming the report configuration, we see a desktop where we can place items.
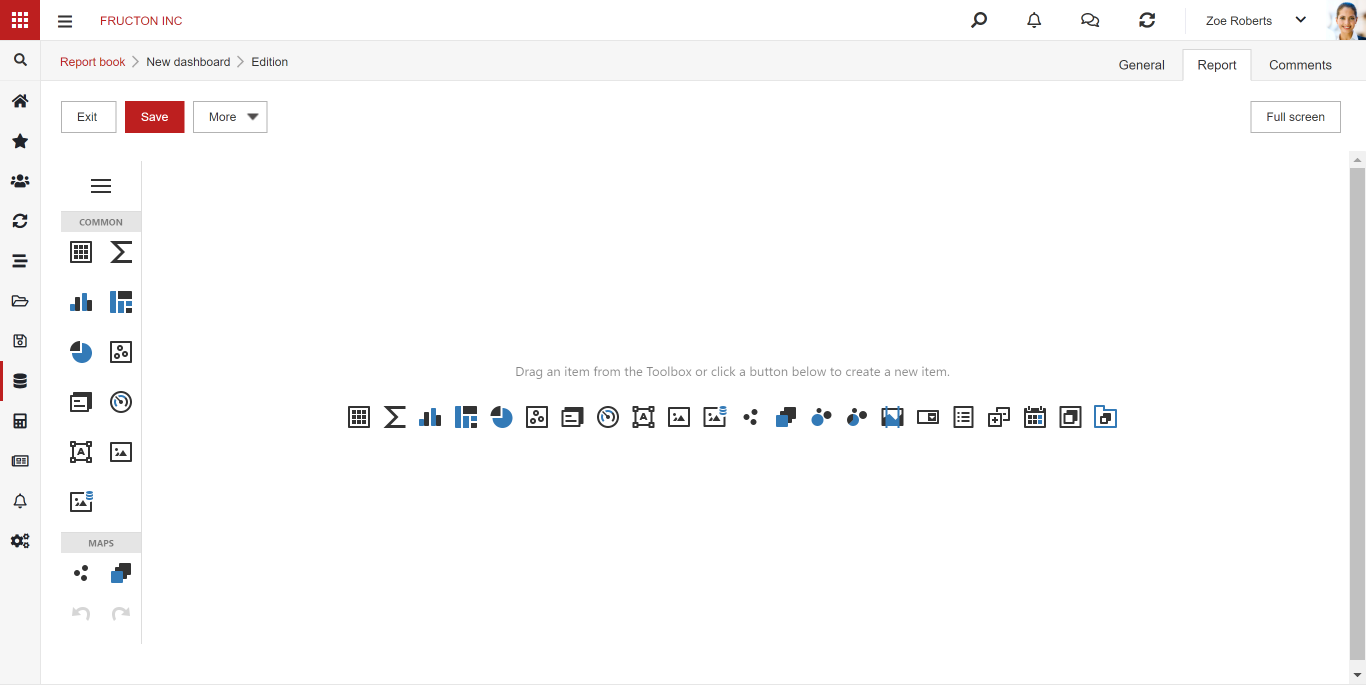
We can place multiple charts on the desktop by dragging them from the toolbox on the left.
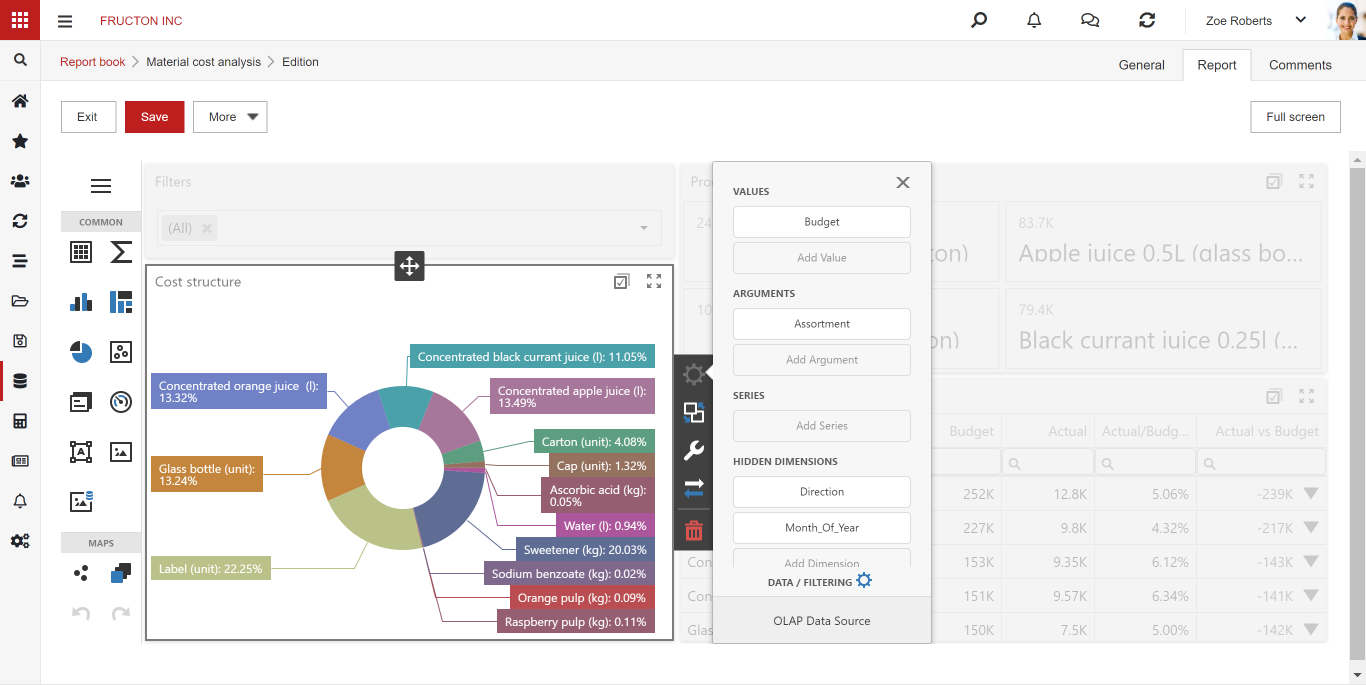
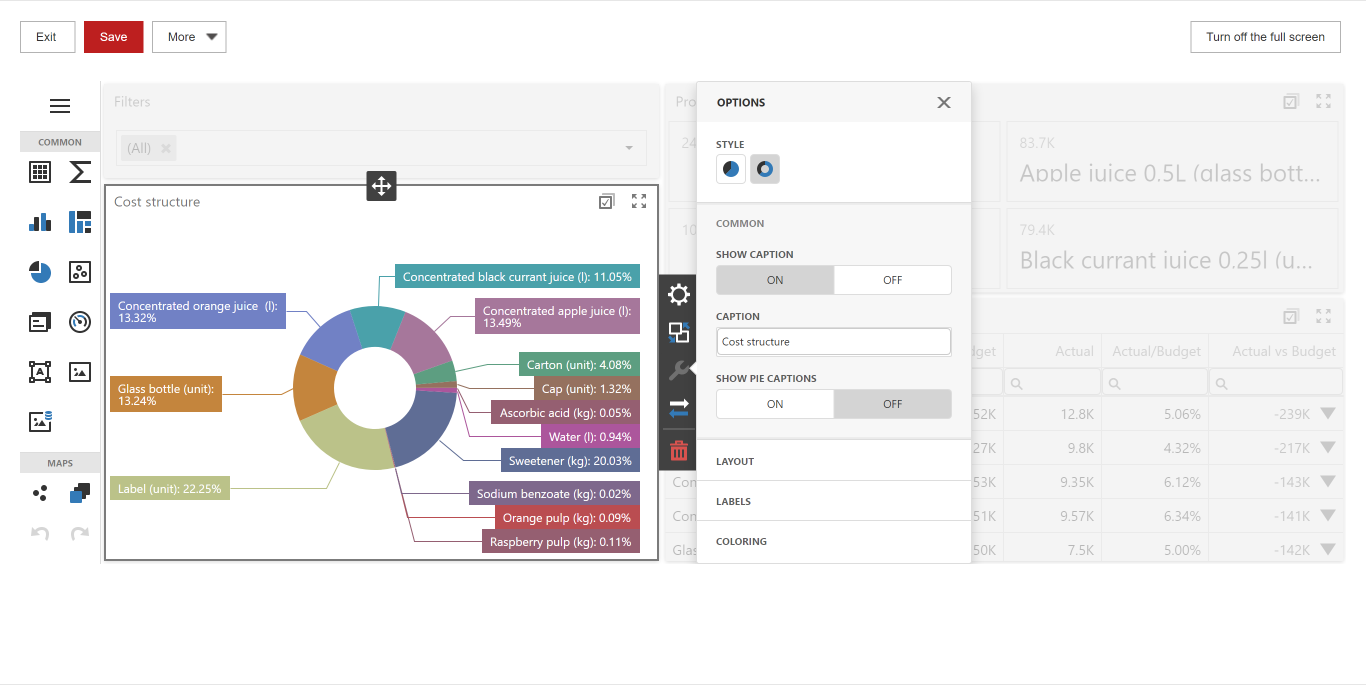
In addition to typical desktop charts, you can also add items such as a pivot table or maps.
Each desktop element must be configured. Typically, you must provide values and arguments. For tables, you must configure columns. Examples of desktop element configurations may look like this:
Data sources
This is where the configurations of all data sources that we can use when defining reports are saved.

As a rule, the configuration of data sources is created during the implementation or prepared by the system administrator.

In the case of OLAP cubes, it consists in providing the server address and configuration of the connection with the data warehouse server.

In the case of a database, you must provide the function that will be used to retrieve data from the SQL database
Processing
If the possibility of cooperation with the data warehouse is configured in the Navigator system, the processing menu contains information on the status of data processing tasks in the warehouse.

Here, the user can only see if the task has been properly performed. In case of any irregularities, he should contact the system administrator.