Reports application
The possibility to report is one of the key elements of the ERP or Workflow system. Reports allow for brief, graphical or tabular visualization of cross-sectional data from the system. Thanks to the reports it is possible to build management cockpits or specialized pulpits that shows data for specific receivers group, for example board, sales or production team.
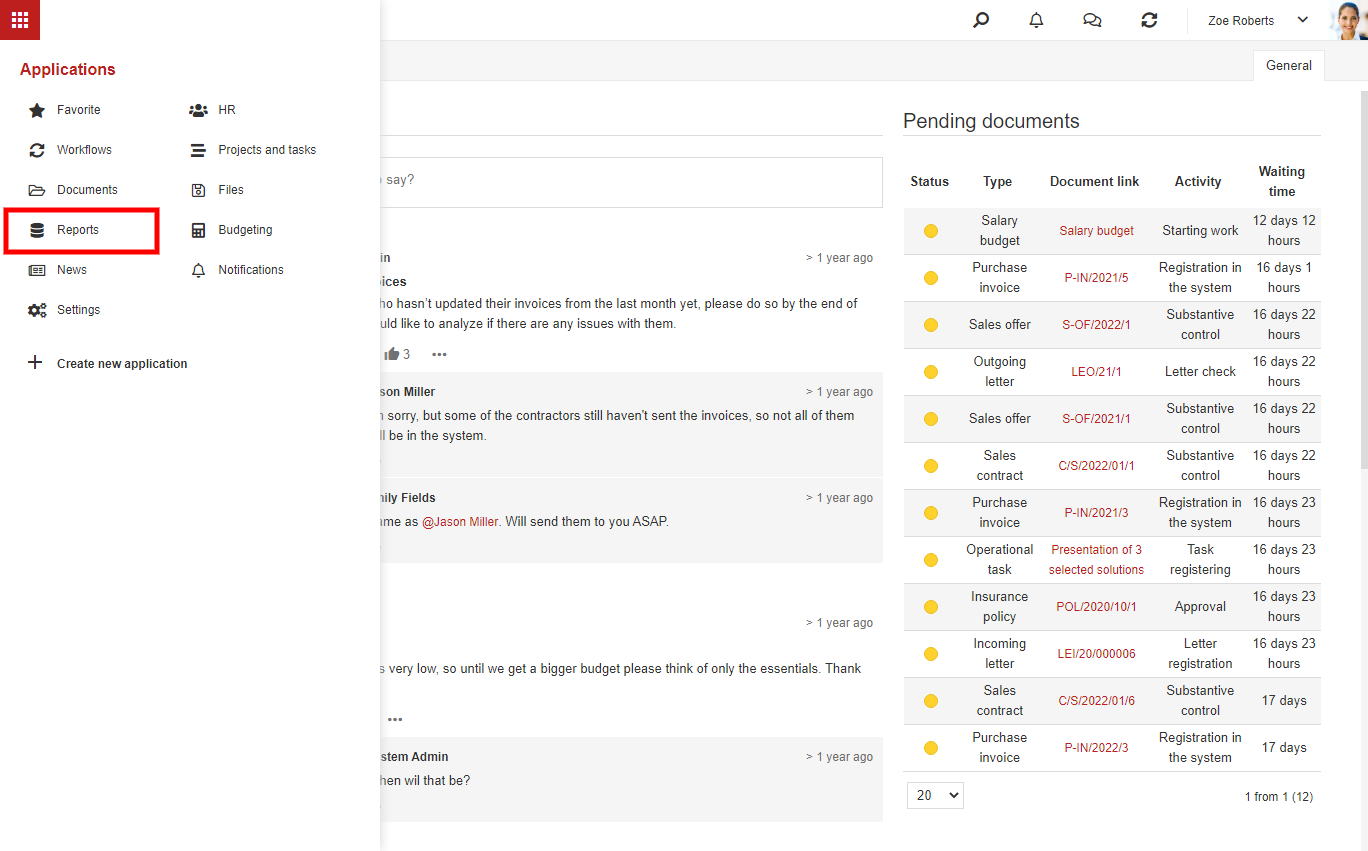
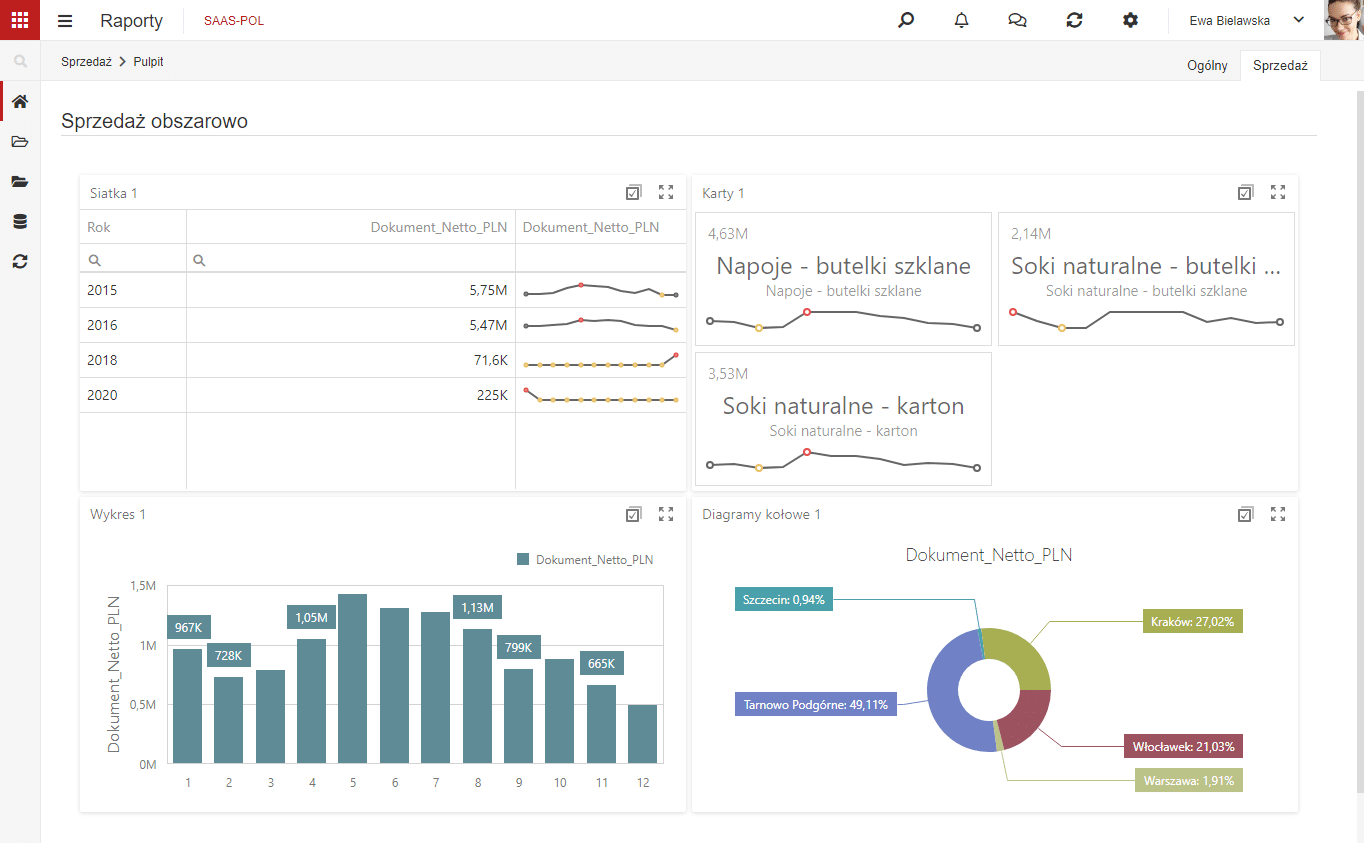
In the NAVIGATOR system there is a Reports application, which lets us present our reports and configurate them. By using data sources configurated in Reports application you are also able to create pulpits with dynamic data visuals, ex:
The Report application alone consists of four modules: My reports, Reports book, Data sources and Processing.
My reports
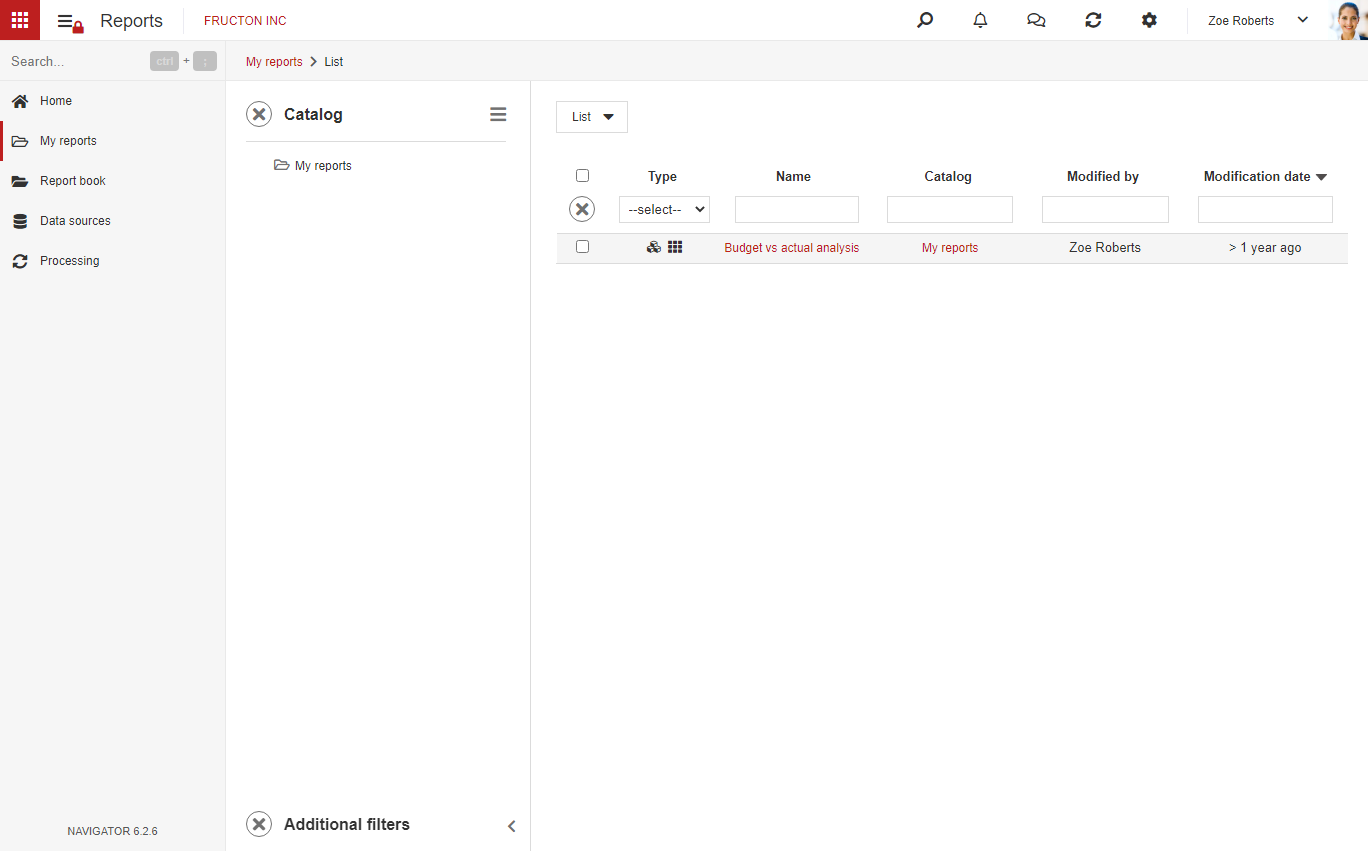
In My reports module there are reports created by current user. They are visible for this user only. In case we want to create our private report, this is the best place to keep it.
Reports can be created from scratch or copied from Reports book.
On example above you can see only one of the report catalogs, nothings gets in the way of making more catalogs and grouping them. Catalogs are working similar as categories for documents or catalogs for files, they are aimed for object grouping.
From report list you can edit or preview the report.
Reports book
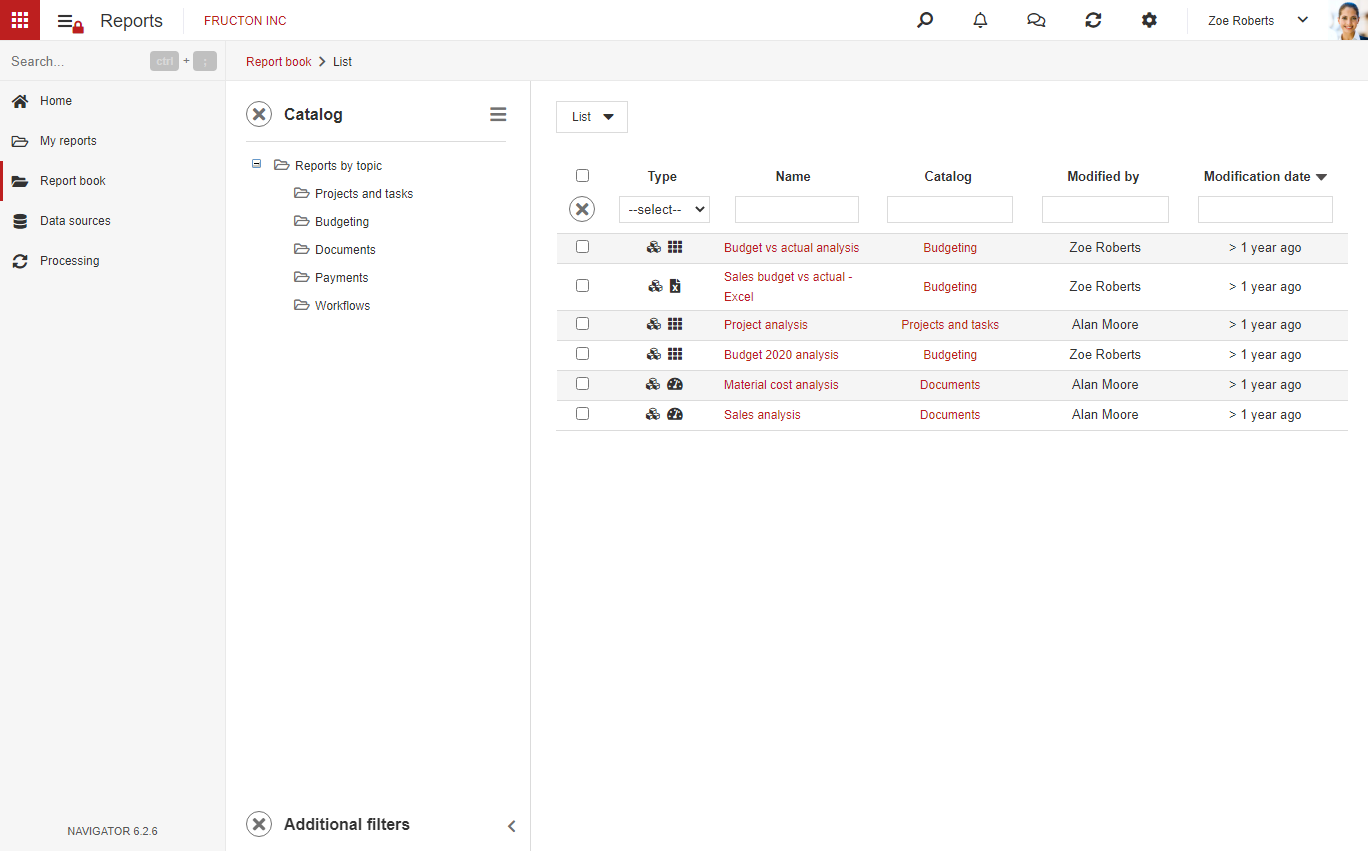
Report book looks exactly as My reports, the only difference is that, in this module reports are accessible for all the users authorized for any particular report.
As it is shown Reports book usually is more complex than My reports. NAVIGATOR system does not come with predefined reports. All reports are prepared in implementation process.
Data sources
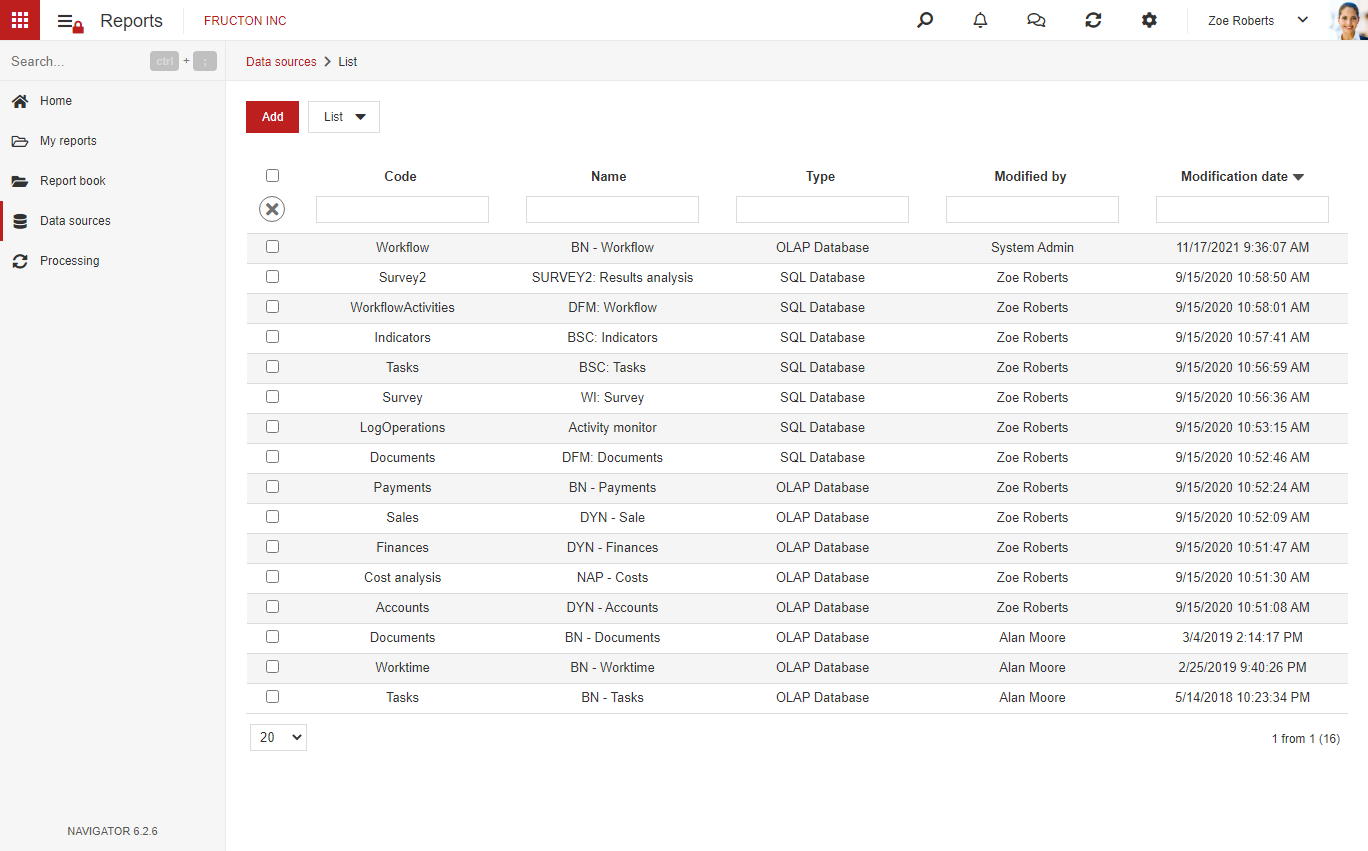
In this module there are all predefined data sources, that can be used in reports.
From this place it is possible to add new source or edit existing one.
Processing
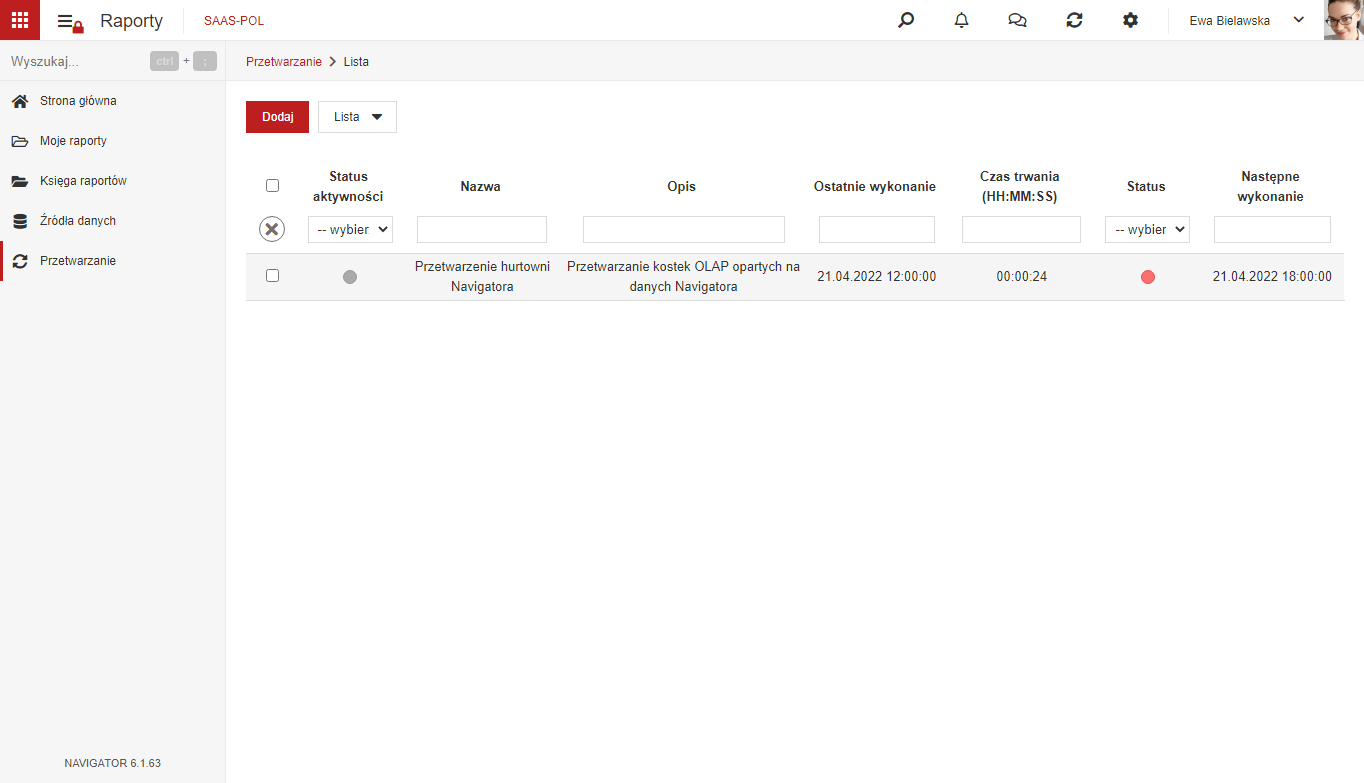
The Processing module consists of regularly starting tasks with goal of data sources actualization. Module has informational character that shows a status of data processing.
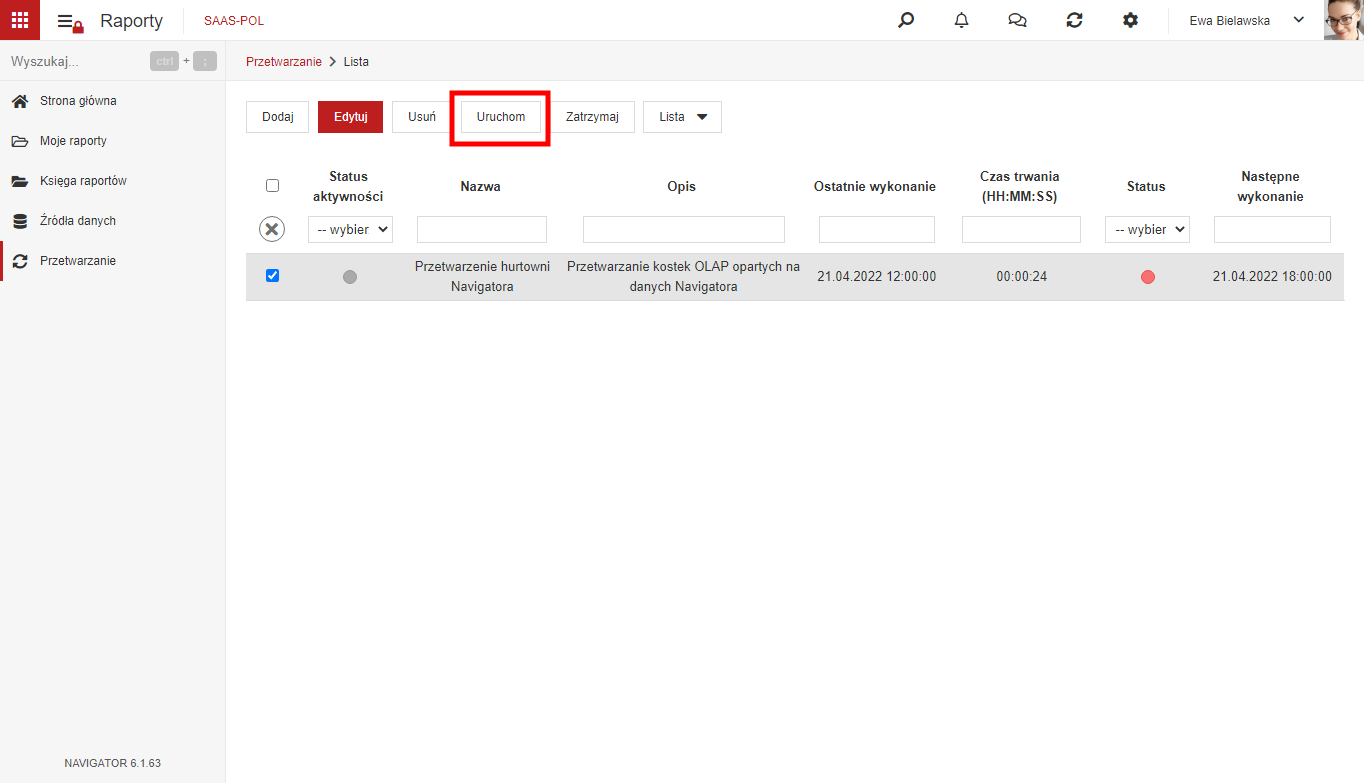
From this place we can manually start data processing. After checking particular task, the button shows up, that allows tasks to start:
Every task is responsible for specific group of sources based on the same database. On the list of tasks you can see the name of the task, data of last action, status and next execution. Creating tasks is taking place during implementation process and usually has no need for further modification.
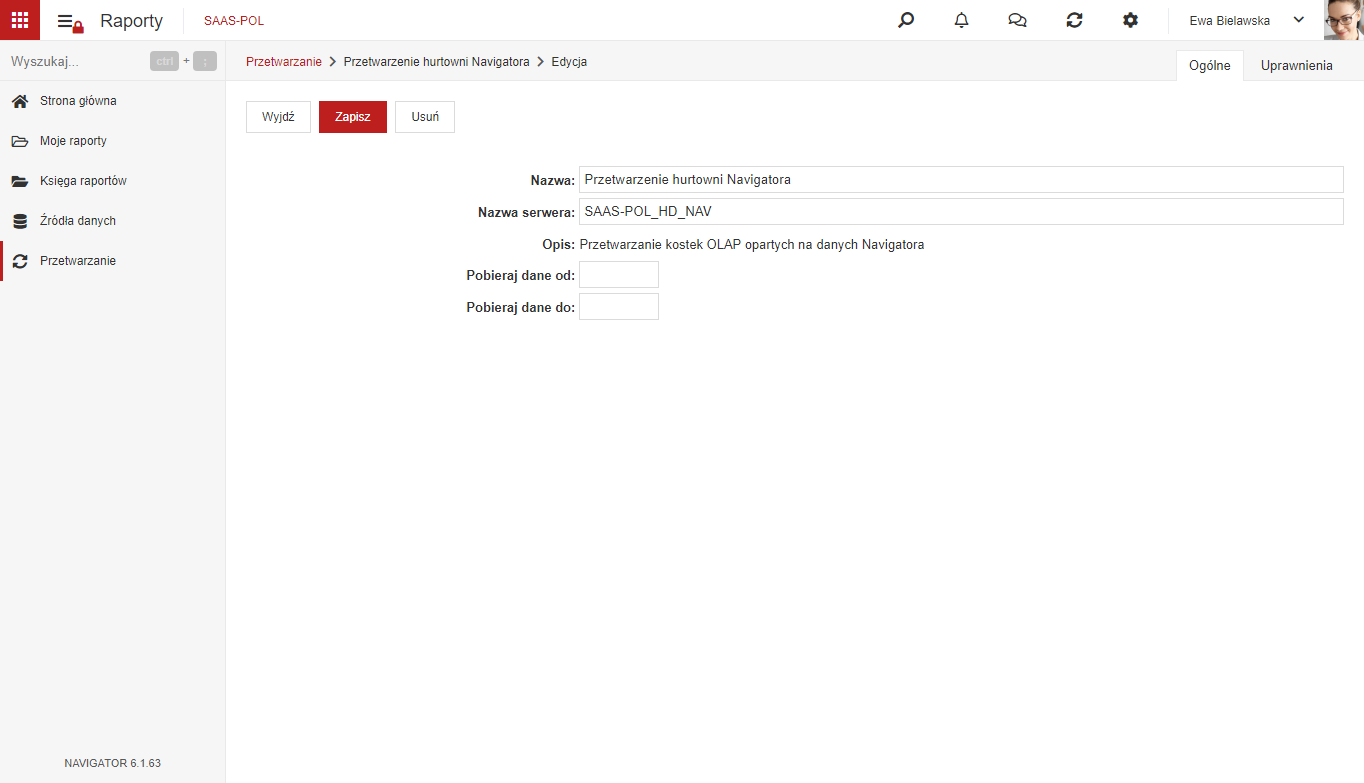
In edition view you can enter the tasks and the servers name. The data range is optional and doesn’t require filling.
Creating data sources
As we mentioned before, system doesn’t come with predefined data sources. They need to be created during implementation process, but can be also prepared later.
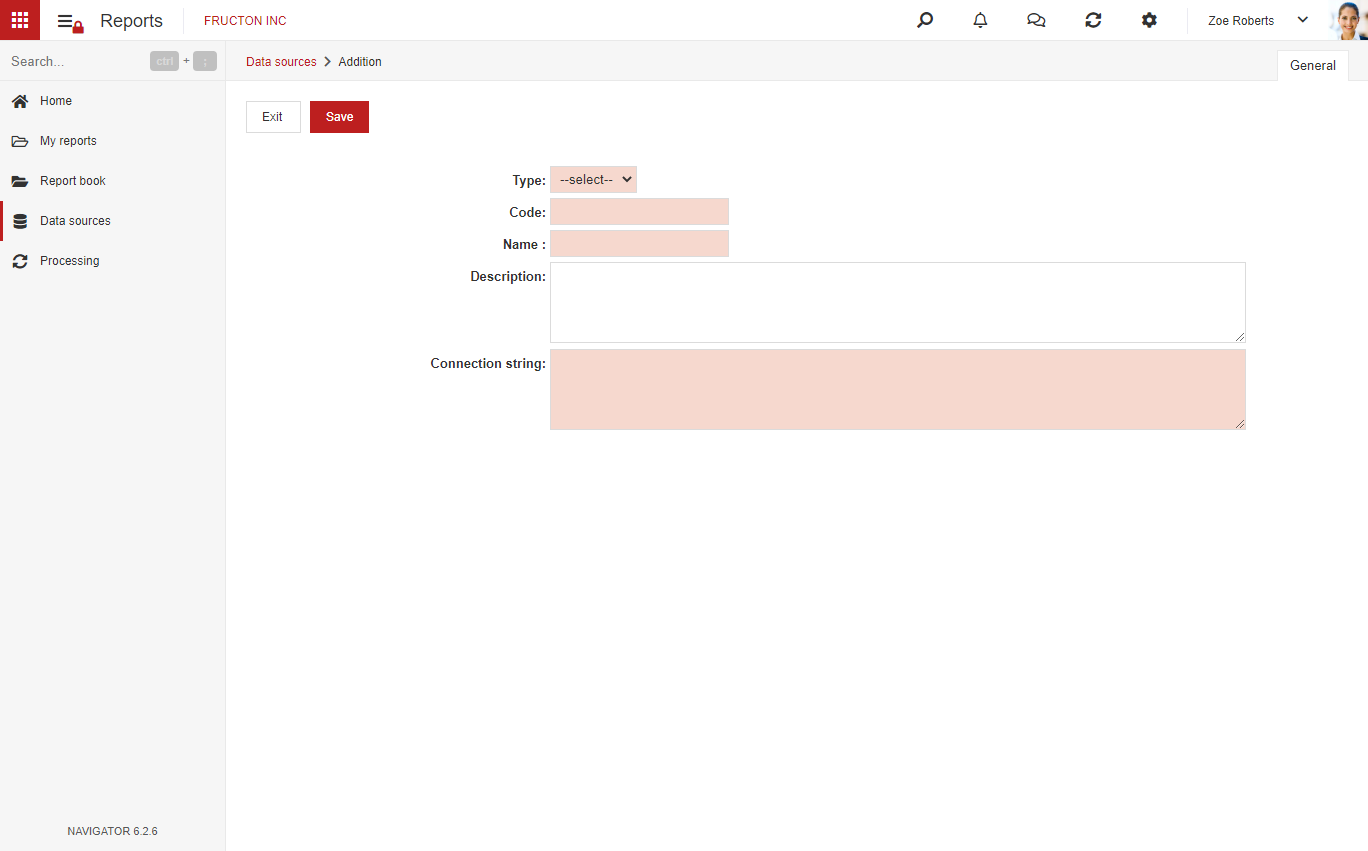
The basic information that needs to be given during data source creation is the type. There are few possible options to choose:
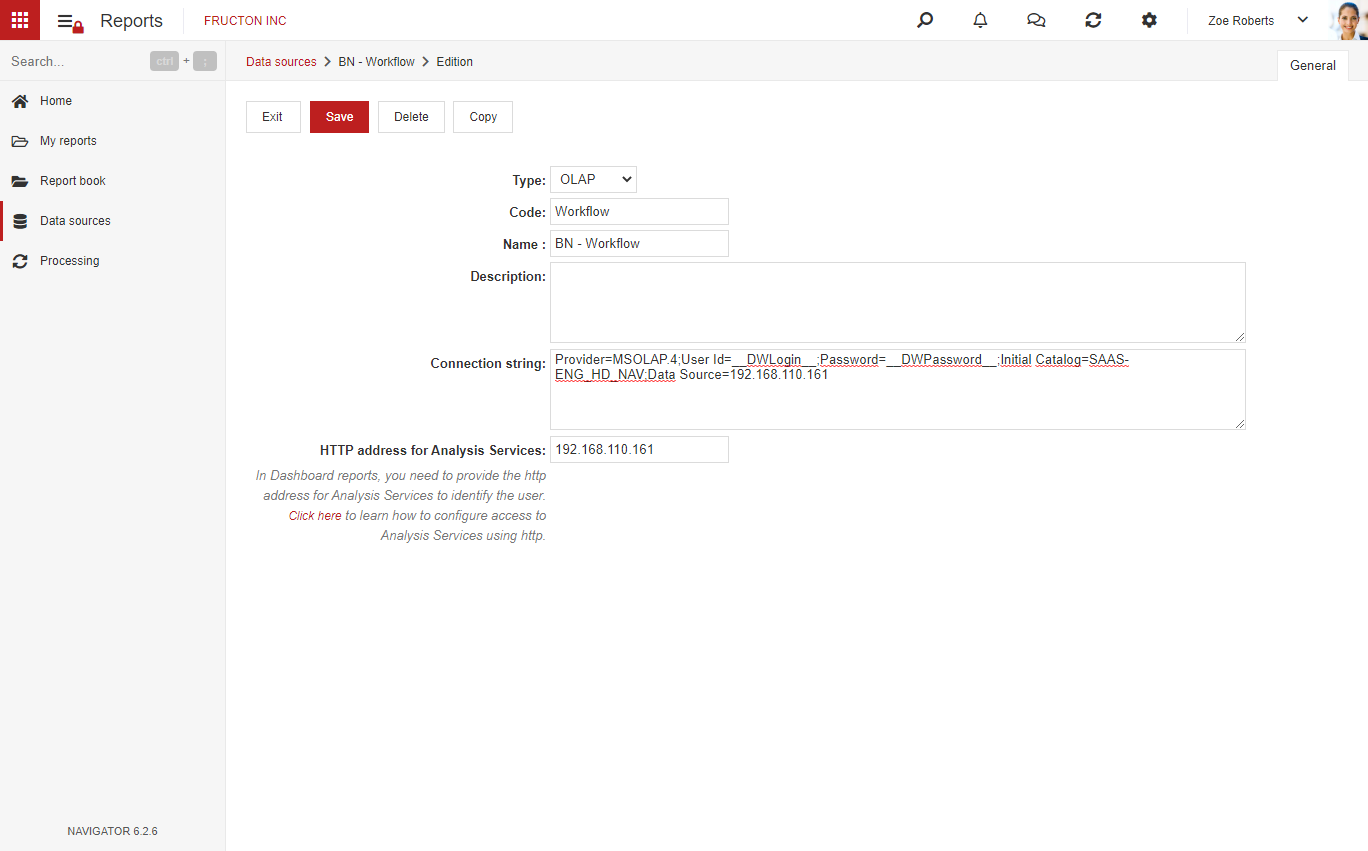
OLAP – data source based on OLAP cube. OLAP cube (On-Line Analytical Processing) is a multidimensional dataset consisting of data from transaction systems such as ERP, Workflow etc. Cube building and her multidimensionality allows for data analysis in many cross-sections (ex. time, organizational structure, costs categories etc.). Cube structure and lack of transactionality of database operations allows for very quick work. OLAP cube can store data from multiple systems. It is definitely the best analytical solution. The disadvantage of this solution is a necessity for OLAPs cube design and production. Usually it is done during the implementation process by personnel specialized in data warehouse and Business Intelligence systems.
Below is the example of data source configuration base on OLAPs cube.
SQL – data source based on SQL query. Similarly to OLAPs cube, this type is also based on dataset, however instead on using specialized structure like OLAPs cube, it functions on a regular SQL query. In configuration you are required to fill up the name of the SQL function written on the database server. Configuration of this source is more easier than with OLAPs cube, because it requires only a simple correct SQL query. Remember however, that this data source will be slower and more limited than OLAPs cube.
Below is the example of data source configuration base on SQL query.
Other types of data source: RS – Static Report, LIST – List and EXCEL – excel file, all need to be configurated directly on the report.
Fields Code, Name and Description can contain any value, user decides what to put in here. Field Connection string a special field, it requires string with connection parameters.
In case of SQL type user is required to enter the function according to formula FunctionName(’User ID=__DWLogin__’, ‘Password=__DWPassword__’). In case of OLAP type user is required to put entire length of connection to data warehouse according to formula Provider=MSOLAP.4;User Id=__DWLogin__;Password=__DWPa.
The last option is a server address than needs to be given in case of OLAPs cube configuration.
Creating the report
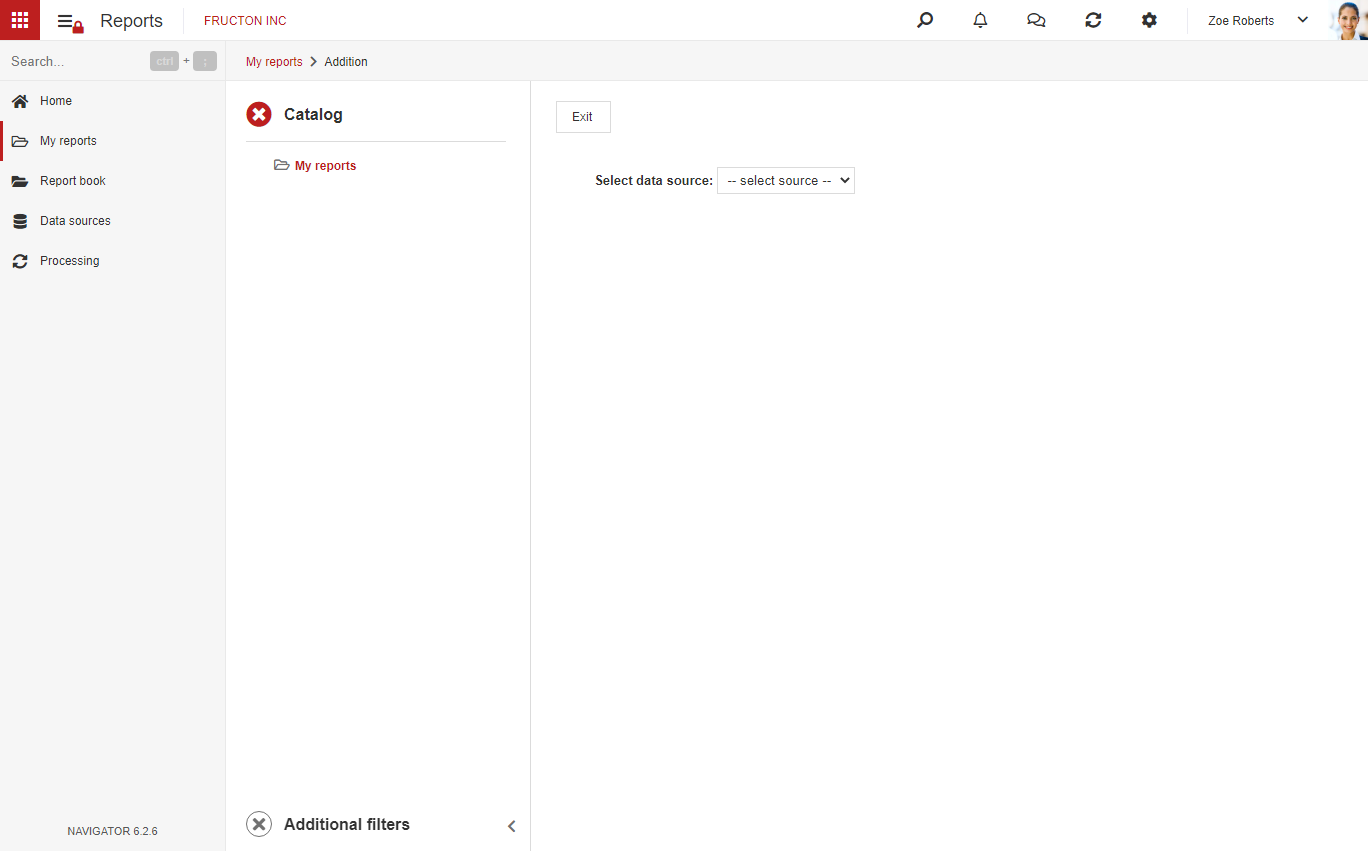
When creating report, user is required to configurate data source and choose type of report. Since the options differ according to data source, the looks of the form will be displayed dynamically, according to option chosen.
Data source
We’ve got 5 different data sources to choose from:
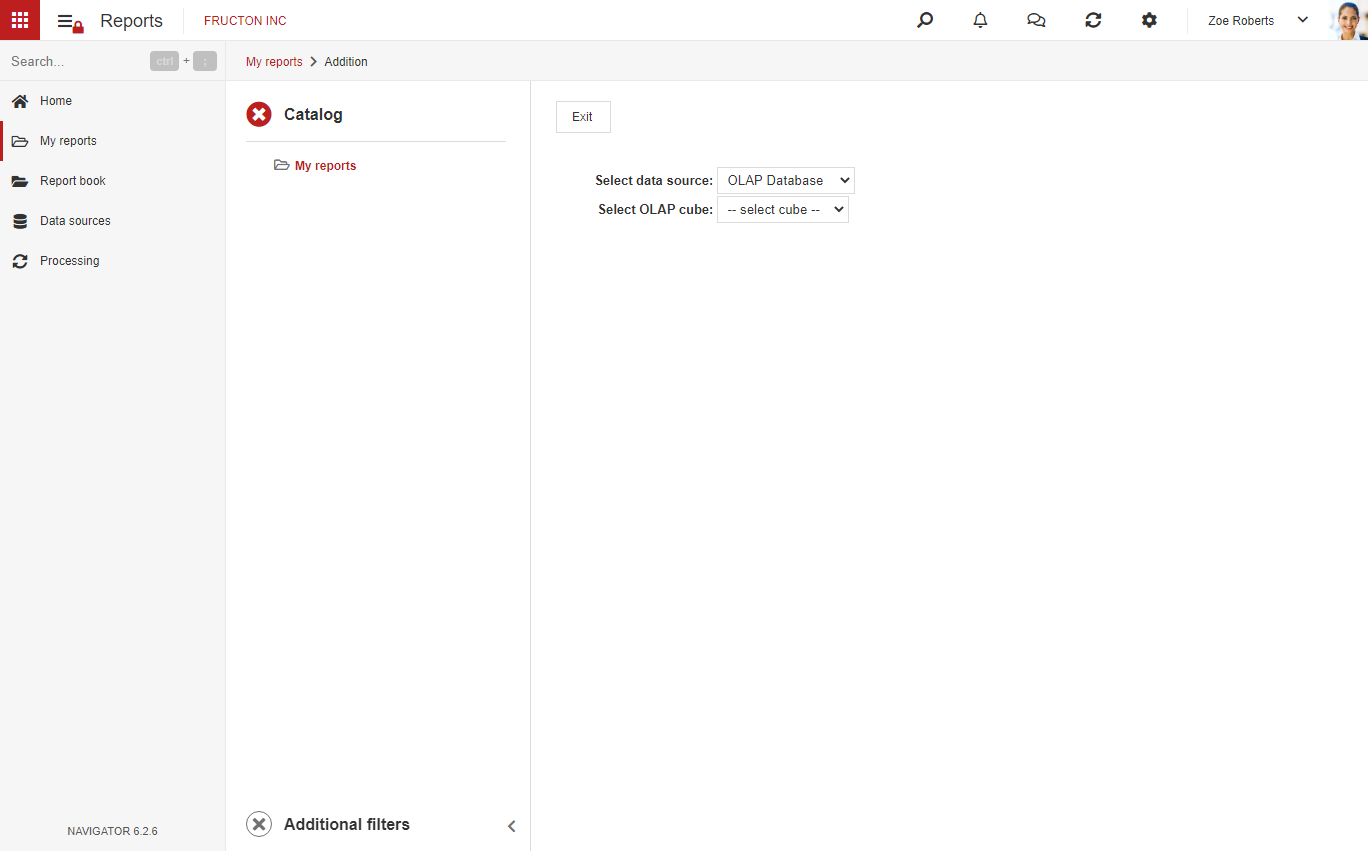
OLAP Database – after choosing this option, the indicator light with earlier predefined cube will show. We can choose only cube earlier predefined in data sources.
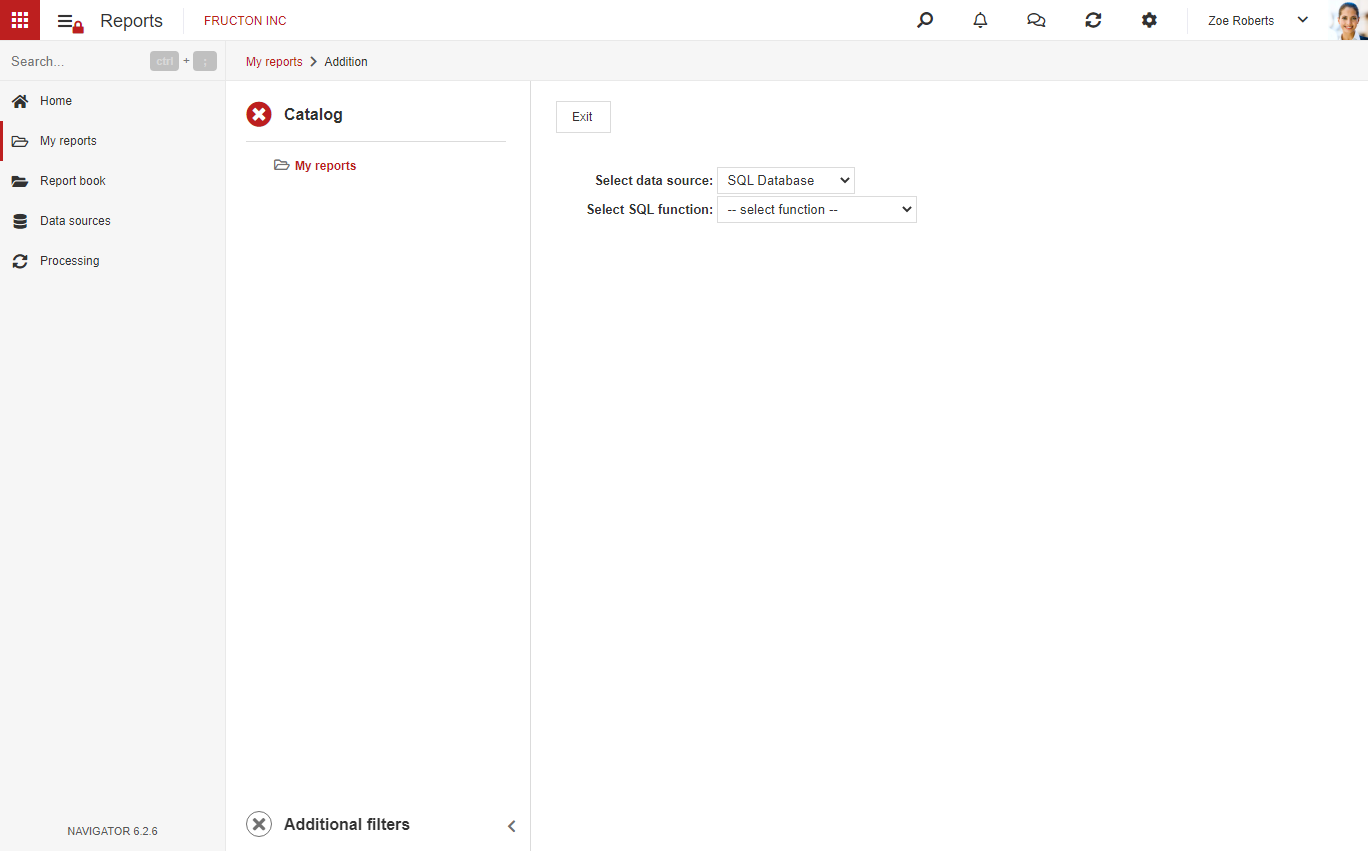
SQL Database – after choosing this option, the indicator light with SQL function will show. Similarly to OLAPs cube, we can choose only from functions earlier predefined in data sources.
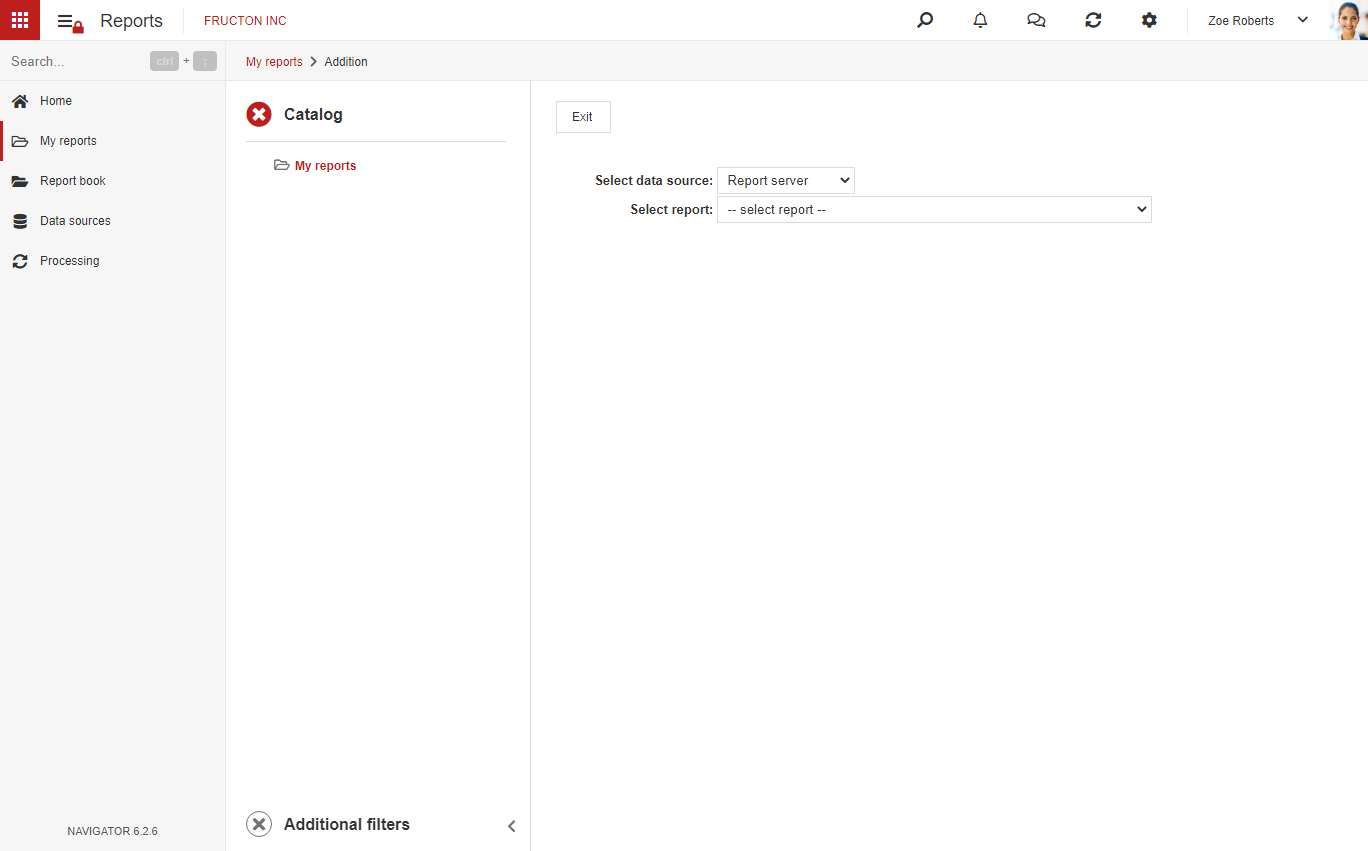
Report sever – after choosing this option, the indicator light will show, from which we can pick report predefined on the report server. Note: reports server configuration is being done through system settings, which can be find in Settings > Miscellaneous> Settings.
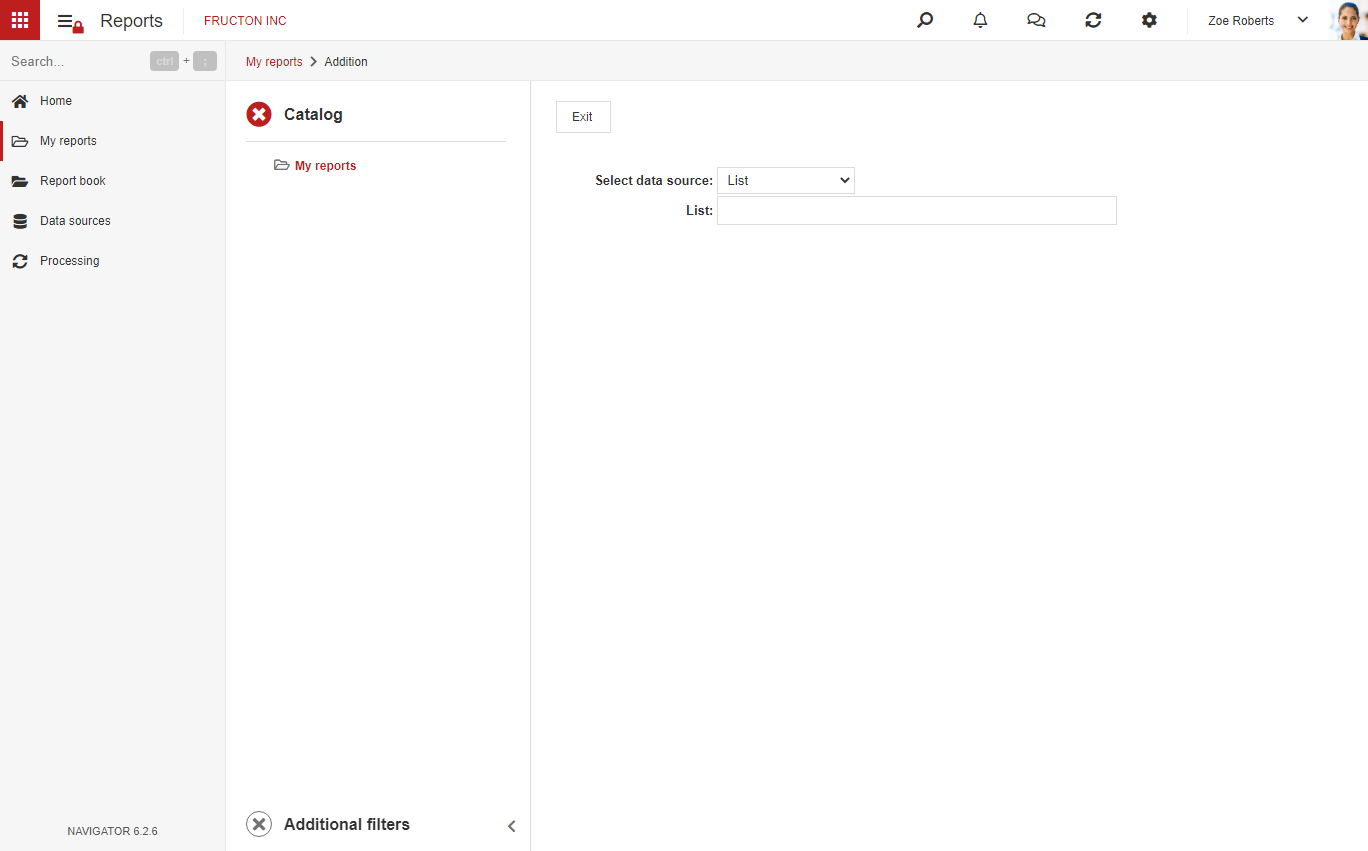
List – after choosing this option we can build reports based on lists base from NAVIGATOR system. It allows for very simple report building based on lists predefined in system.
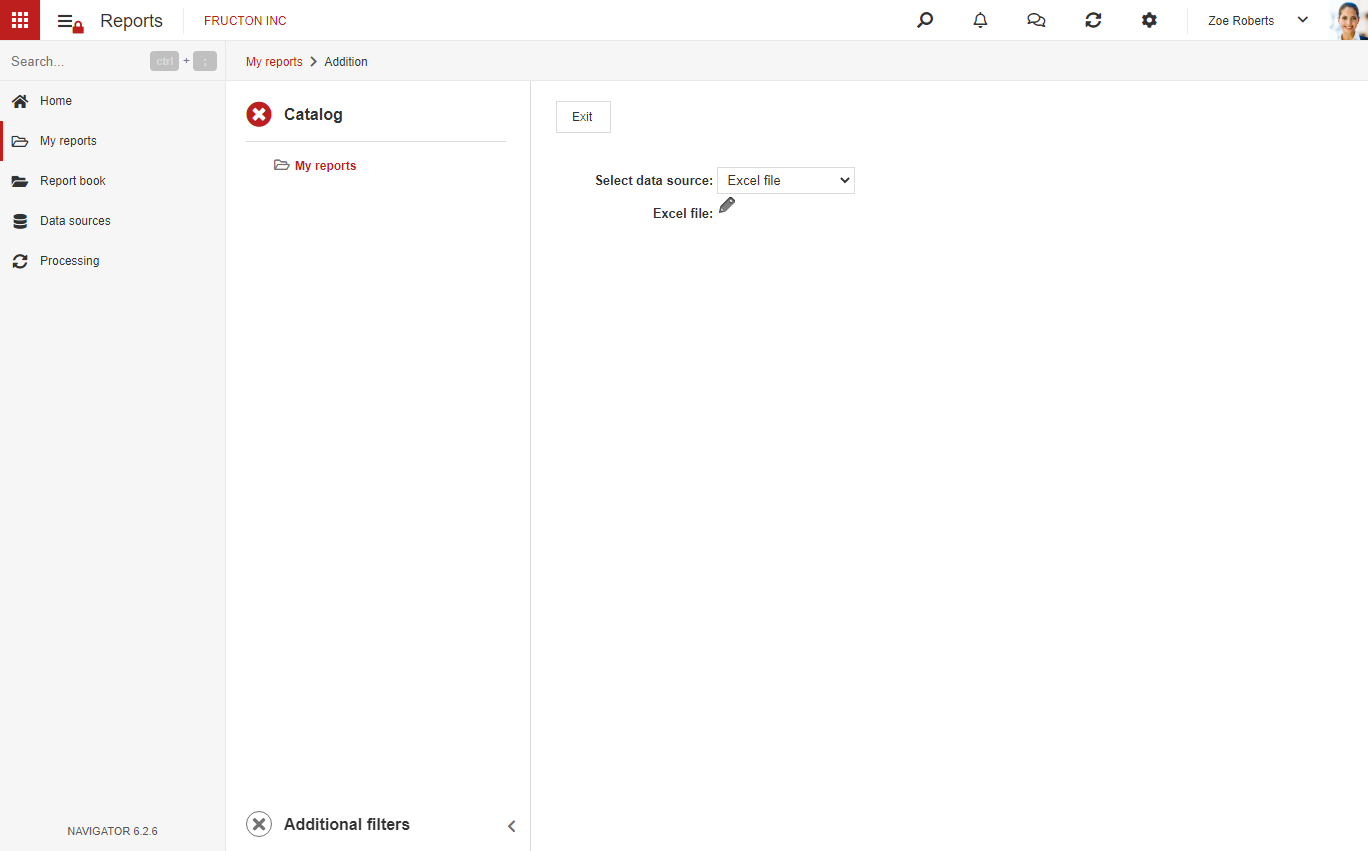
Excel file – the last option allows us to pick excel file, which will be used as a data source for a report. In configuration just pick file in a standard Windows window, that will show after pressing the pencil icon.
Report type
The last parameter that we need to fill is a report type. There are 3 options than we can choose from:
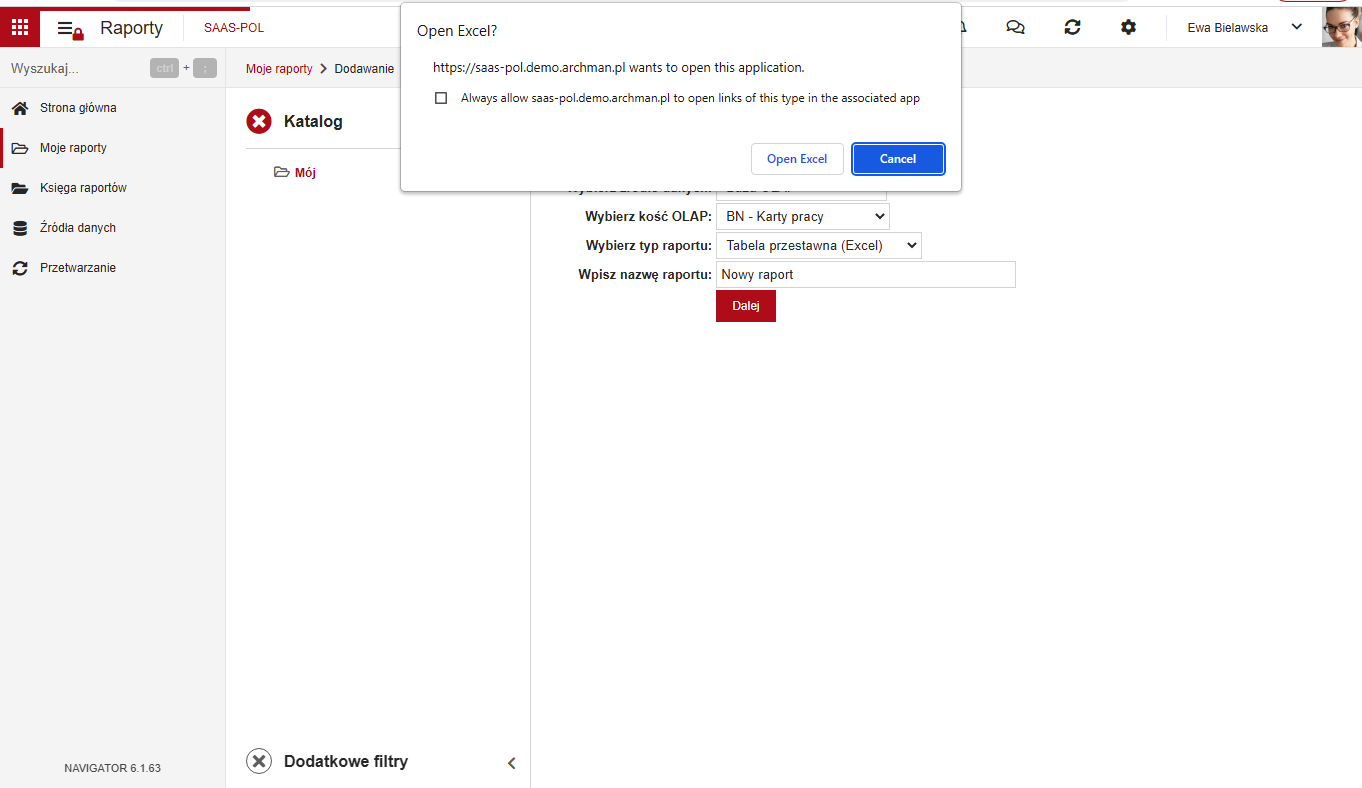
Pivot table (Excel) – this option allows us to build pivot tables based on the MS Excel program. After choosing this option, naming the report and pressing Next, the system will ask you to open Excel.
After opening the Excel program we can create a Pivot table the same way as a normal pivot table in Excel. After saving, the system will remember our settings and the opening of the new report will show Excel document which was set before.
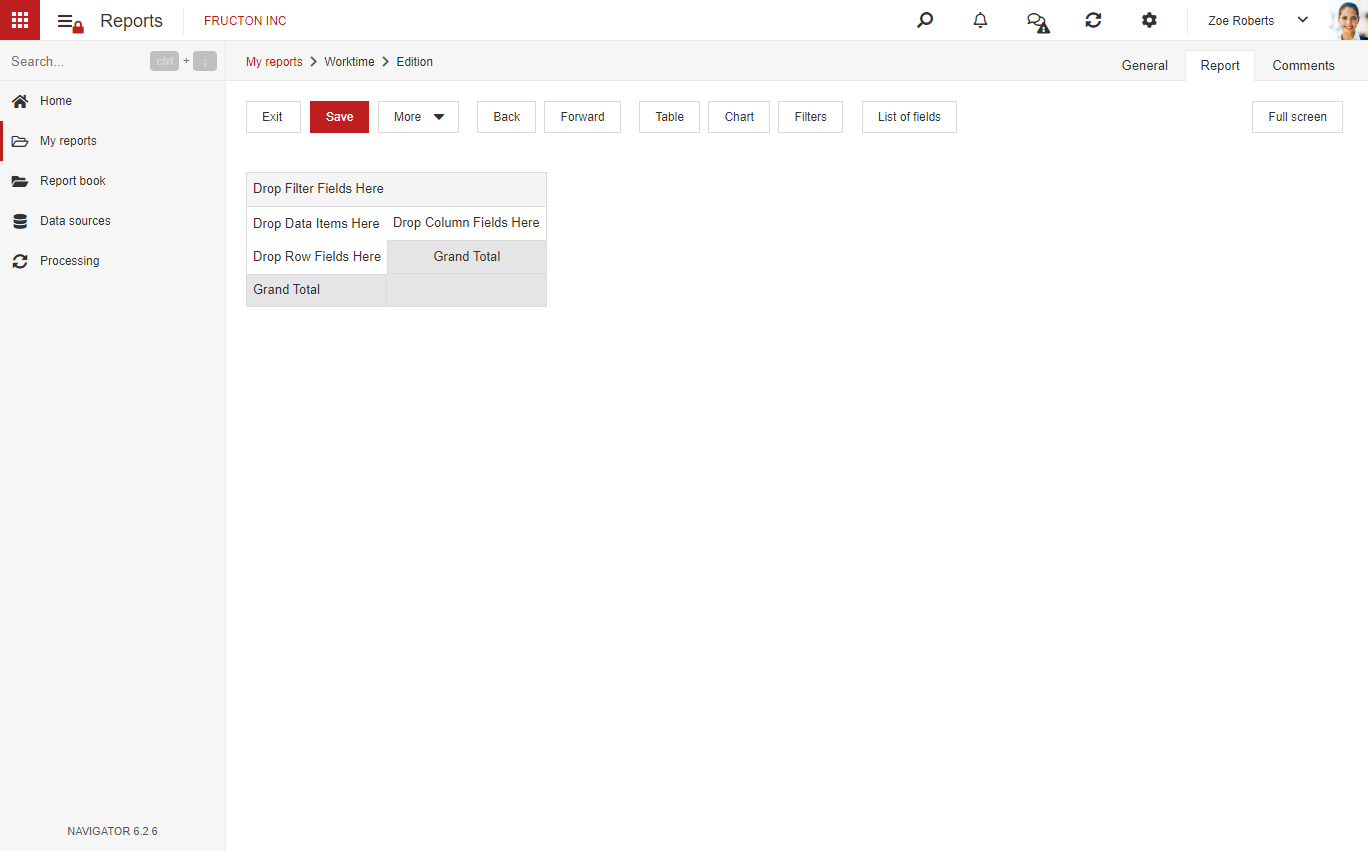
Pivot table (Express) – this option works almost the same as previous one with only difference being that instead of using Excel, it uses built-in indicator light to create pivot tables. Built-in control light has less options than Excel, however it can be used immediately without additional costs of Excel license.
After choosing all the options and pressing Next the window will show with configurable pivot table.
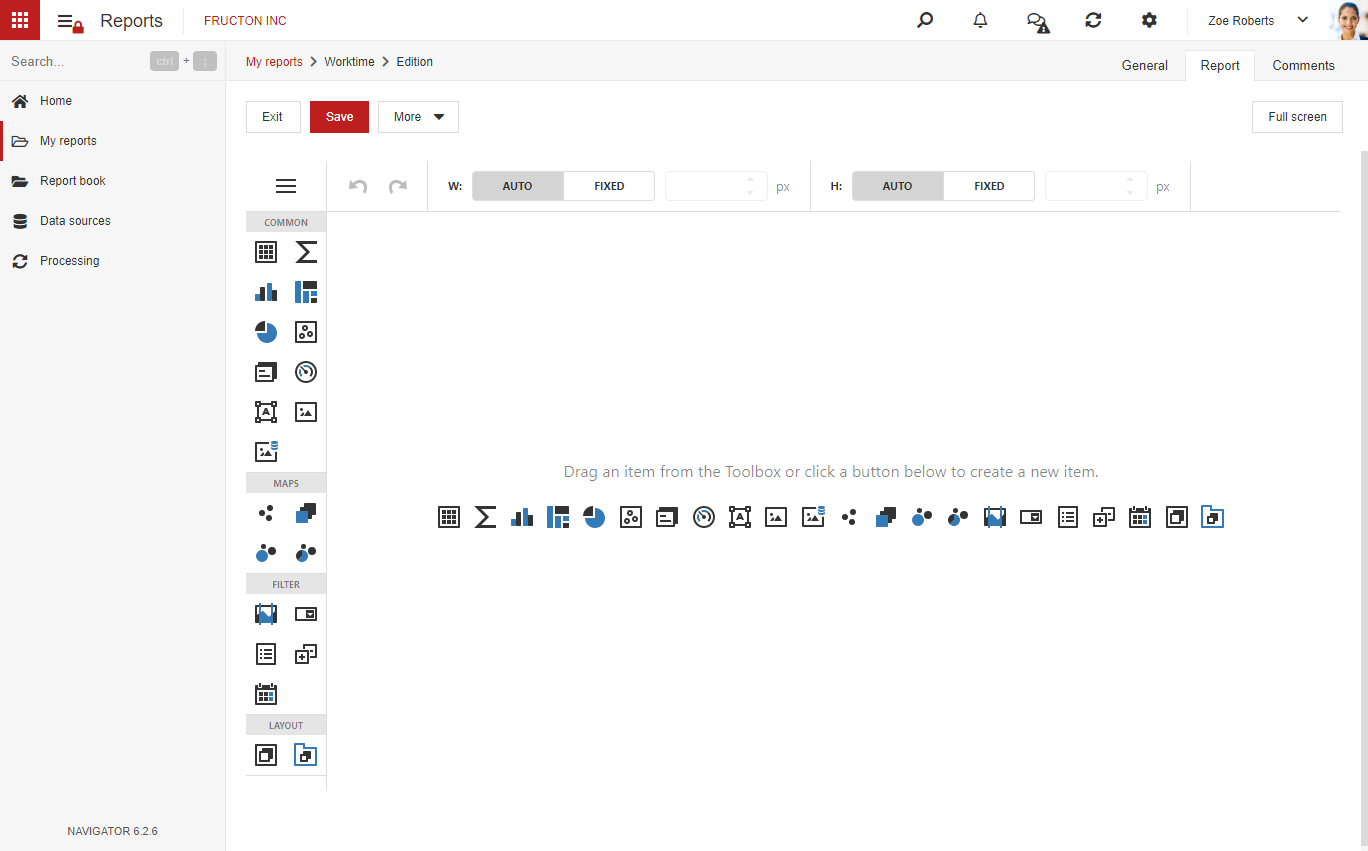
Dashboard – the last option is Dashboard. It allows for creating visual representation of data in the form of diagrams, interactive maps or tables based on data from data source.
After choosing this option and saving the report the window will show with pulpit configuration, where we can set individual elements.
Configuration report
The way of creating reports presented in this article doesn’t fully cover the entire topic.
After configurating data source correctly and creating the report it needs to be configurated further by setting the pivot table or arranging and configurating active elements on the pulpit. This topic is so wide that if requires separate article.
For every type of the report: Pivot table (Excel), pivot table (Express) and Dashboard separate article has been written, that covers configuration of the specific report.


